
Description
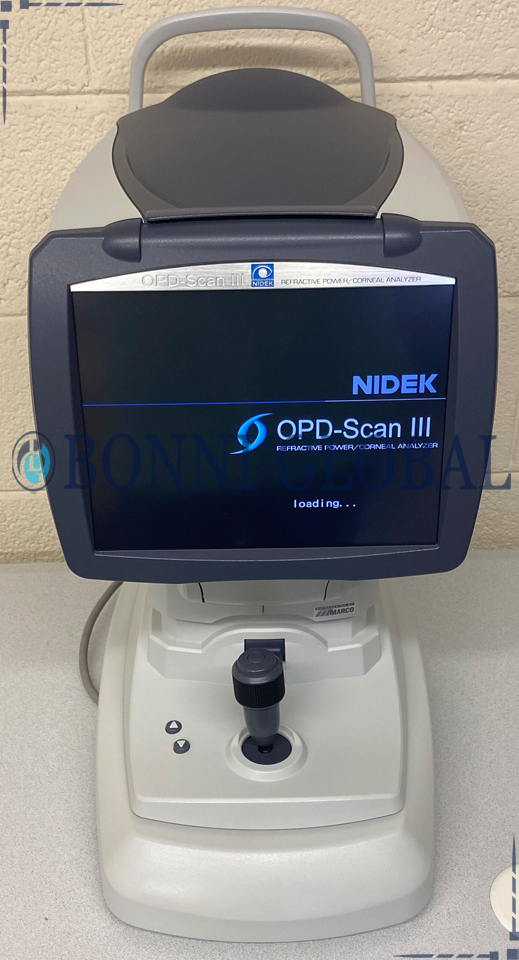
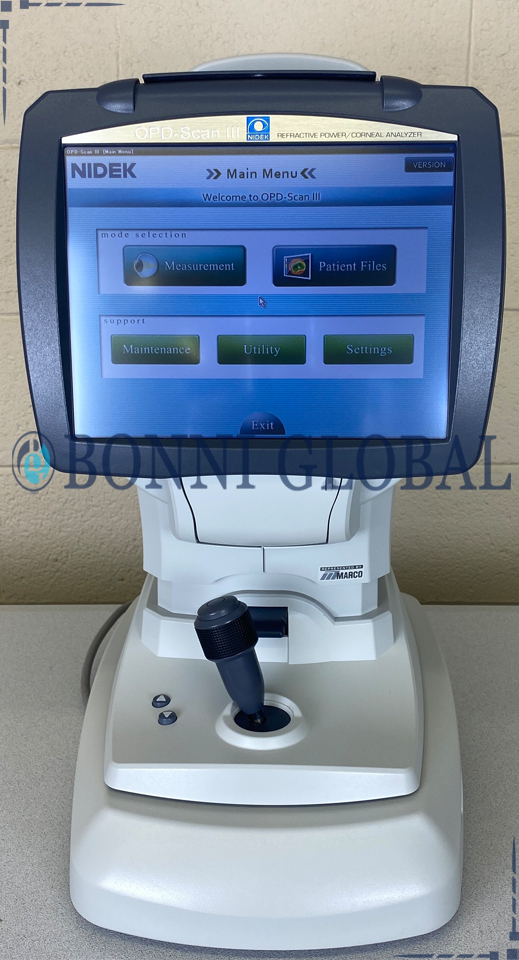
The Nidek OPD Scan III is a state-of-the-art corneal analysis tool that offers thorough evaluations of the cornea’s topography and optical properties. This advanced device combines several diagnostic capabilities, such as wavefront analysis and pachymetry, allowing eye care specialists to acquire accurate measurements essential for diagnosing a range of corneal issues.
Nidek OPD Scan III Corneal Analyzer is an autorefractor, keratometer, pupillometer (up to 9.5mm), corneal topographer, and integrated wavefront aberrometer. The OPD-Scan III completes 20 diagnostic metrics in less than 10 seconds per eye (including angle kappa, HOAs, average pupil power, RMS value, and point spread function).
Next Generation of Refractive Eye Care
The unique Nidek OPD-Scan III Corneal Analyzer is an advanced vision assessment system that combines topography, wavefront, automated refractor, keratometry, and pupillometry.
Make Optimal Decisions Easily
The OPD-Scan offers multiple map summaries to suit you practice or clinical requirements with easy-to-understand patient reports and even more details for comprehensive vision analysis.
Enhanced Patient Comfort
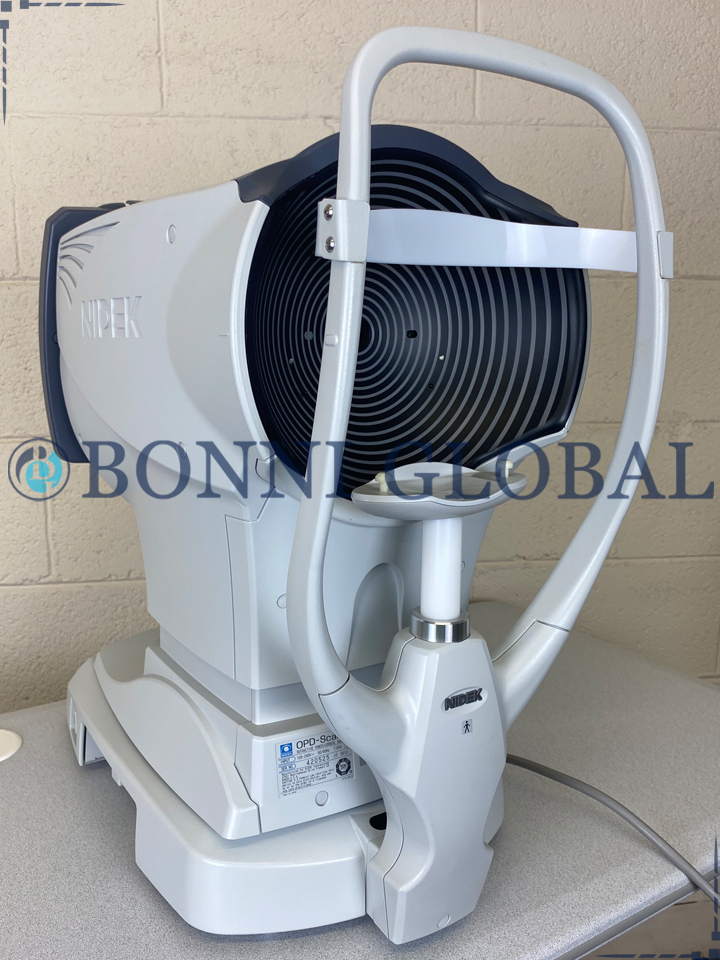
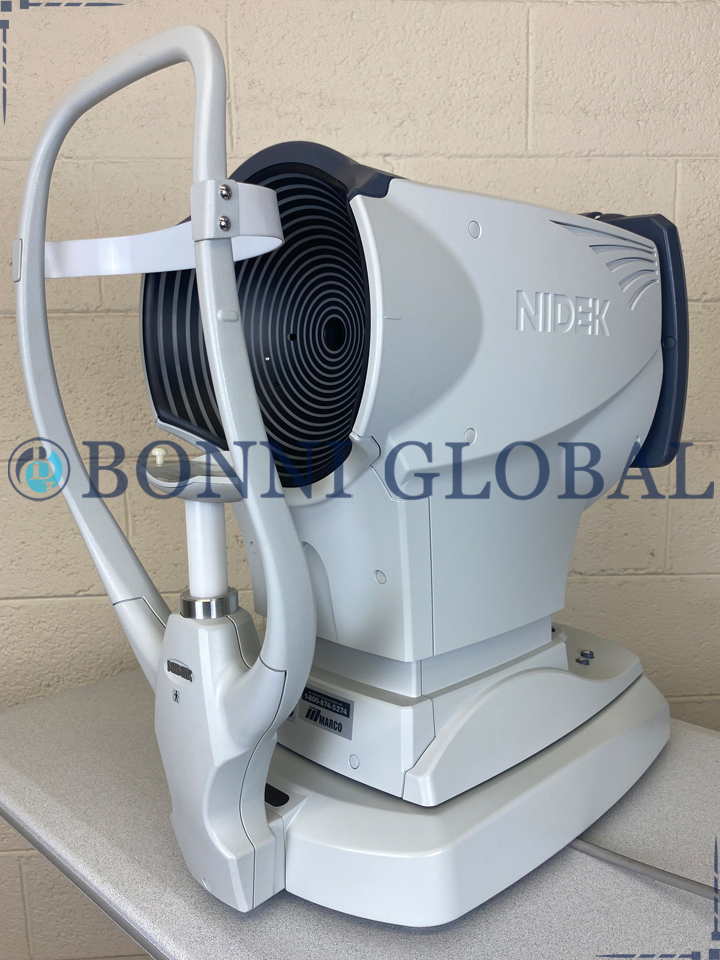
33 blue placido mires provide a minimum of 11,880 data points which is more than 170% of the OPD-Scan II. The blue wavelength allows greater precision in ring detection. The reduced illumination creates a comfortable patient experience.
Outcome Simulation of Postoperative Corneal Shape and Total Eye Refraction
The optional Final Fit software evaluates and converts the OPD-Scan III refractive and topographic data to produce the precise customized ablation parameters for the NIDEK EC Quest Excimer Laser System.
Data View Options
Axial, gradient, instantaneous, numeric K display, numeric power display, PSF (point spread function), zernike graph (including corneal), contact lens summary, VA-ETDRS simulations, internal OPD, eye image, comparison maps, and difference maps.
Unique Features
Cataract and refractive surgeries have now been taken to another dimension. Detailed patient summaries are available in just a matter of seconds. Pre-op toric axis alignment can be mapped to iris or other physical landmark positons. Retro illumination images can be used post-op to verify IOL axis alignment.
Dysfunctional Lens Syndrome (DLS)
The above map is a measurement of a prior myopic LASIK patient with Dysfunctional Lens Syndrome (DLS). The Point Spread Function (PSF) maps show that the cornea is contributing to the problem but the majority of the patient’s issue is lenticular change. The patient thought she needed another LASIK treatment, when in actuality, the lens changed.
Day/Night Wavefront Refractions
This provides information on the stability of the refractive error as pupil size changes, and the individual starting points for separate day and night refractions, if indicated. Your patients can receive a state of the art printout of their ‘before’ and ‘after correction’ chart or understand why they are not able to achieve 20/20. Welcome to the next generation of refractive eye care.
Captured In 10 Seconds
- Corneal SA for Aspheric IOL Selection
- Lenticular – Residual Astigmatism
- Angle Kappa/Angle Alpha
- Pre/Post Toric IOL Measurements
- Pathologies (Keratoconus, Pellucid)
- Mesopic/Photopic Pupil Size
- Retro Illumination Image
- Zernike Graphs: Total, Cornea, Internal
- Corneal Refractive Power Map
- IOL Tilt Eye Image or Decentration
| TECHNICAL DETAILS | |
| Power Mapping | |
| Spherical Power Range | -20.00 to +22.00 D |
| Cylindrical Power | 0.00 to ±12.00 D |
| Axis | 0 to 180° |
| Measurement Area | 2.0 to 9.5 mm (7 zone measurement) |
| Data Points | 2,520 points (7 x 360) |
| Measuring time | < 1.0 seconds |
| Measurement Method | Automated objective refraction (dynamic skiascopy) |
| Mapping Methods | OPD, Internal OPD, Wavefront maps, Zernike graph, PSF, MTF graph, Visual Acuity Corneal Topography |
| Measurement Rings | 33 vertical, 39 horizontal |
| Measurement Area | 0.5 to 11.0 mm (r = 7.9) |
| Dioptric Range | 33.75 to 67.5 D |
| Axis Range | 0 to 359˚ |
| Data Points | More than 11,880 |
| Mapping Methods | Axial, Instantaneous, “Refractive”, Elevation, Wavefront maps, Zernike graph, PSF, MTF graph, Visual Acuity General Information |
| Working Distance | 75 mm |
| Auto Tracking | X-Y-Z directions |
| Observation Area | 14 x 11 mm |
| Specifications | |
| Operating System | OPDIII Windows 10 |
| Display | 10.4-inch color LCD touch panel |
| Printer | Built-in thermal type line printer for data print External color printer (optional) for map print |
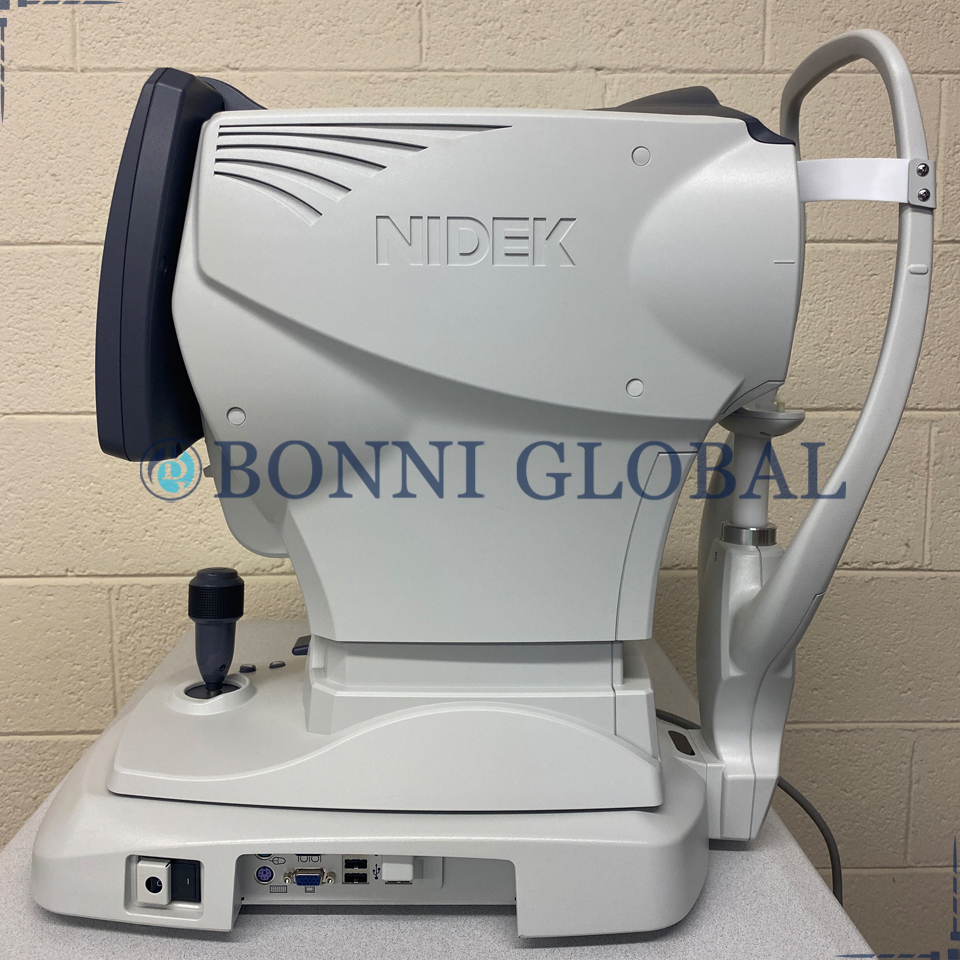
| Power Supply | 100 to 240 Vac 50 / 60 Hz |
| Power Consumption | 110 VAC |
| Dimensions | |
| Measurements | 286 (W) x 525 (D) x 530 (H) mm |
| Mass | 23kg |


